Multispectral drones for crop scouting and mapping
A multispectral drone maps crop health with light bands the eye can't see, so you can find where a field differs, compare dates and build prescription maps. The map shows where to look; a ground check tells you why.
Updated
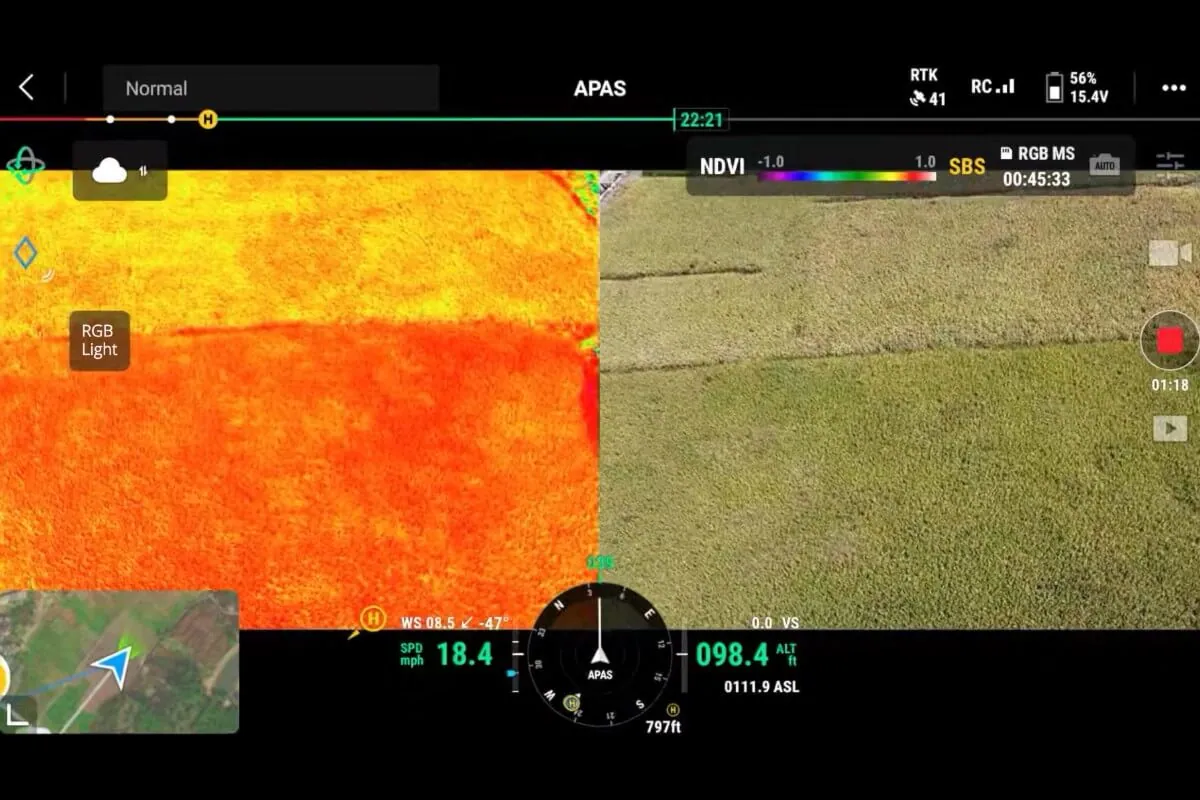
You can't walk every acre
Problems such as poor emergence, drainage, compaction, nutrient stress and disease show up unevenly across a field. Walking it on a schedule misses patches, and satellite images are often too coarse or clouded over when you need them.
See the whole field, then scout the right spots
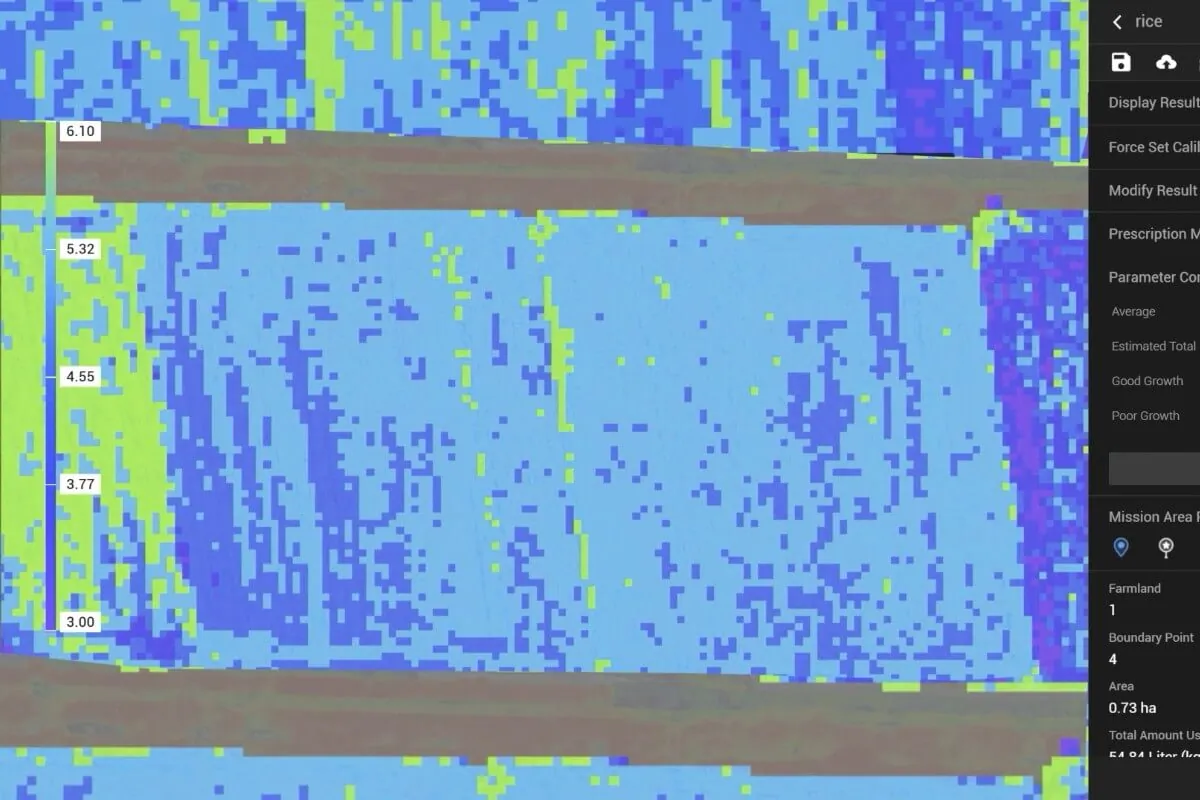
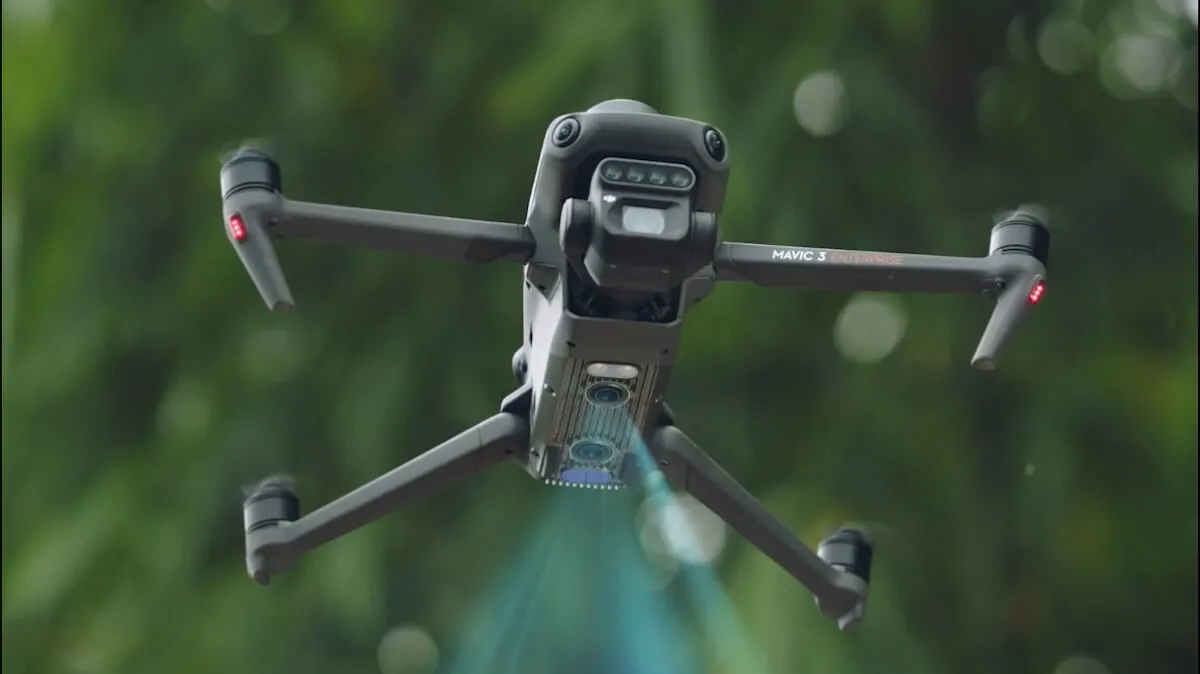
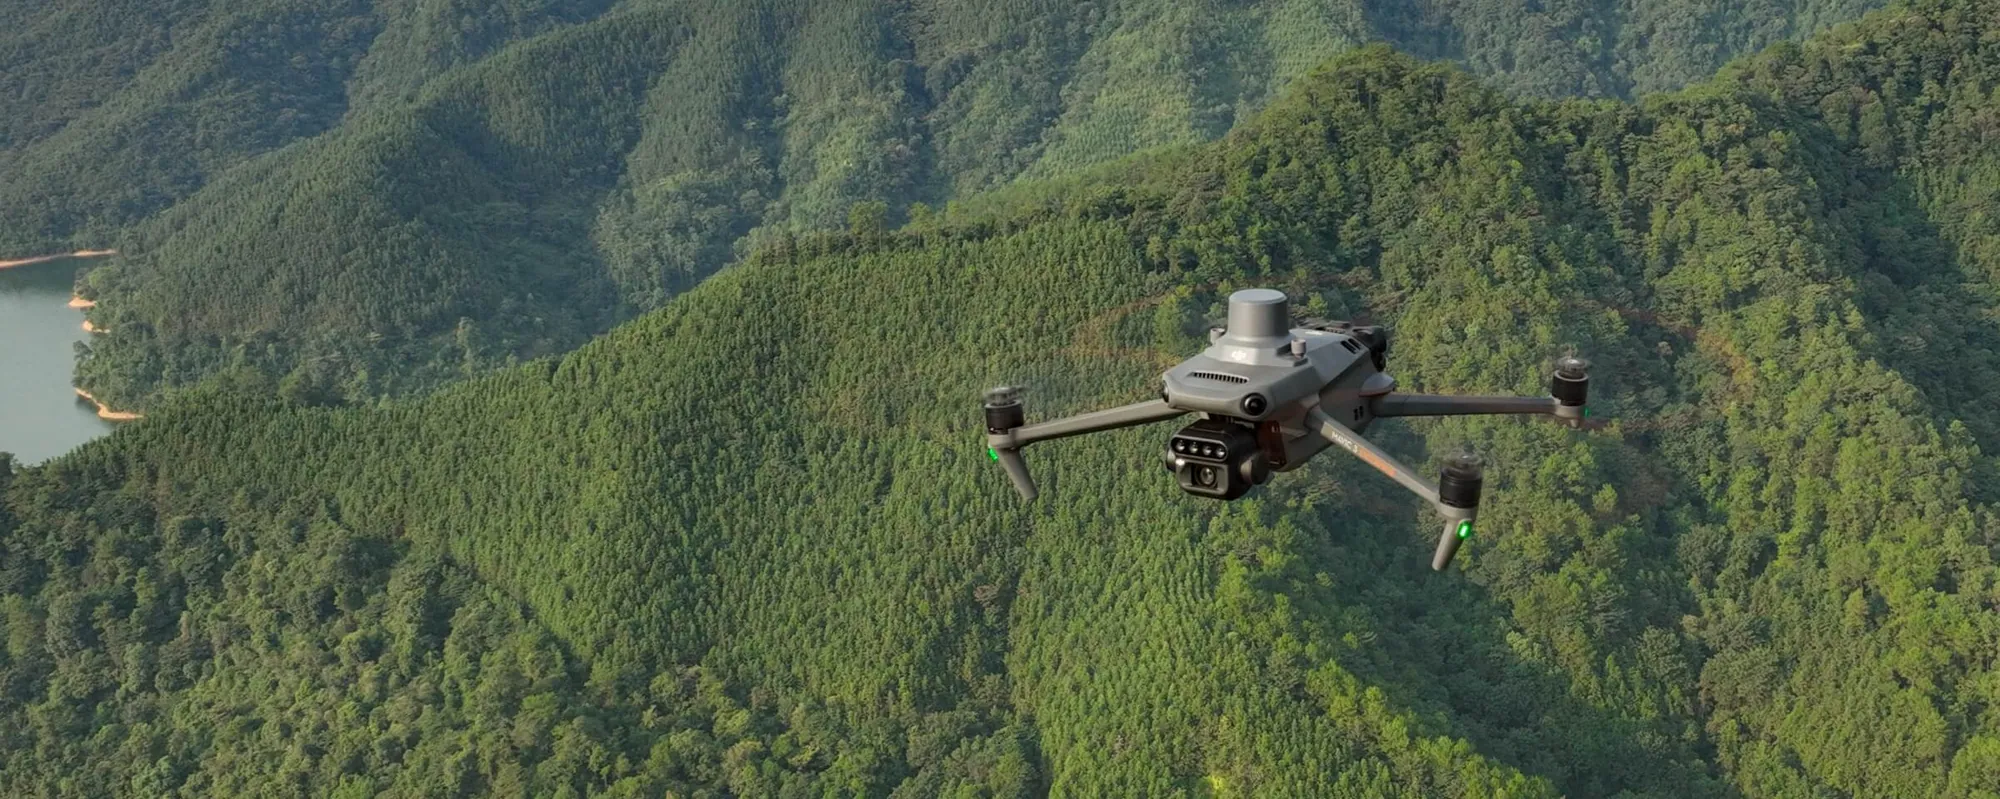
A multispectral drone such as the DJI Mavic 3 Multispectral captures green, red, red edge and near-infrared bands with a sunlight sensor, so you can build NDVI and NDRE maps, compare dates and send scouts to the spots that differ. Maps can become prescription files for an Agras drone.
Maps show where; the ground check shows why
Expect faster, better-aimed scouting and a record you can compare season to season. A map won't diagnose the cause; Canadian research on potatoes, blueberries and grapes paired imagery with ground samples every time.
What the bands and indices show
| Index | Bands | What it highlights | Typical use |
|---|---|---|---|
| NDVI | Red, near infrared | Overall green biomass and vigour | Emergence, stand gaps, early-season variability |
| NDRE | Red edge, near infrared | Chlorophyll in dense canopies, where NDVI saturates | Mid- to late-season nitrogen and stress in corn, wheat, canola |
| GNDVI | Green, near infrared | Chlorophyll and nitrogen differences | Nitrogen zoning |
| RGB | Visible colour | What the eye sees, sharper detail | Stand counts, drainage, damage records |
From flight to decision
- Ask a question first. Where did emergence fail? Which zones need more nitrogen? Which plots differ?
- Plan the flight. Choose how much the photos overlap and how much detail you need, fly around midday in steady light, and use the same settings every time.
- Process the images in DJI Terra, DJI SmartFarm or a third-party tool such as Pix4Dfields.
- Ground-check the zones that differ: dig, sample, look at the plants.
- Act. Change a rate, re-seed, fix drainage, or build a prescription map for an Agras T50 or T100 once an agronomist approves it.
Canadian research examples
- Potatoes, Québec. INRS researchers compared drone observations with soil and plant samples, weather and moisture data across three commercial potato fields near Pont-Rouge.
- Blueberries, British Columbia. A study in two fields near Pitt Meadows rated blueberry scorch virus symptoms in the field and compared them with drone imagery.
- Grapes, Niagara. In six commercial Riesling vineyards, remotely sensed data was linked to vine size, water status, yield and berry composition at some sites and dates, but not consistently enough to set a universal threshold.
The common thread: imagery found the patterns, and ground measurements explained them.
When multispectral isn't the answer
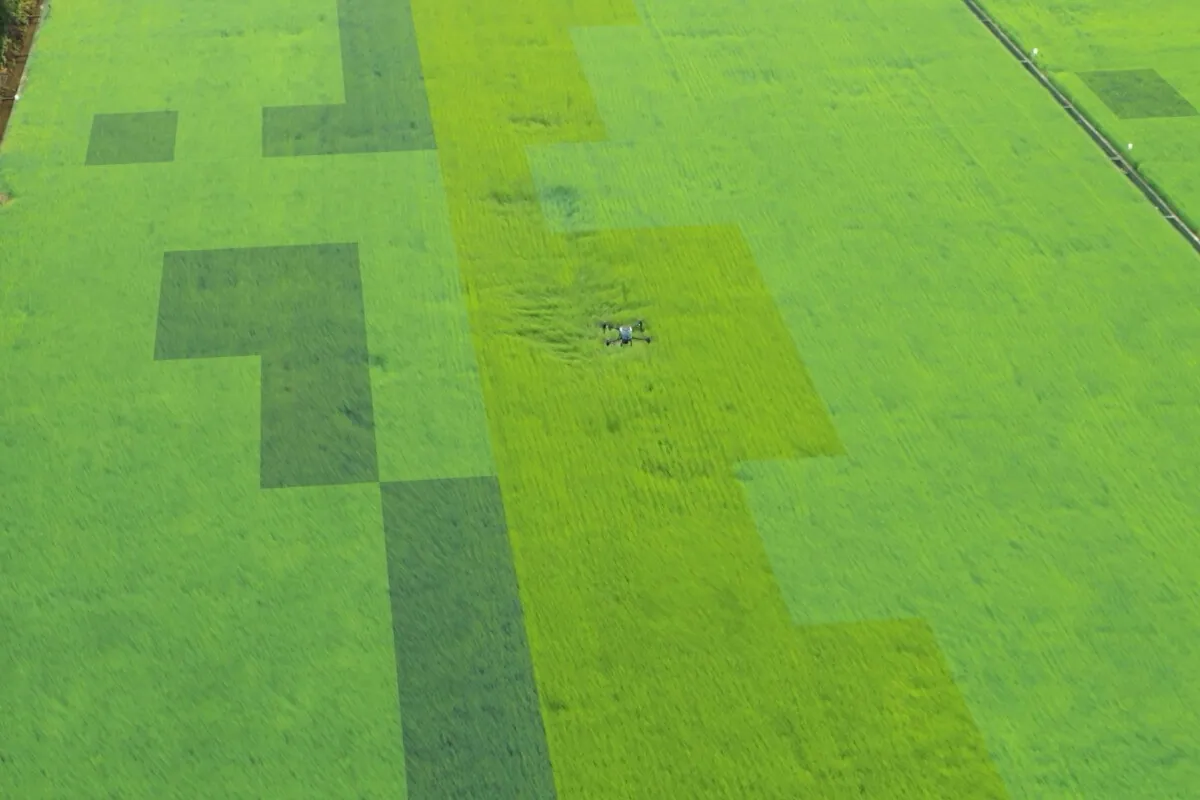
- You need thermal data (for irrigation or livestock): the Mavic 3M has no thermal camera.
- You want a diagnosis without walking the field: maps show patterns, not causes.
- Nobody will process the images or act on them: start with a clear decision and a person responsible.
Licence and registration
At 951 g with RTK, the Mavic 3M must be registered and flown by a pilot with a Transport Canada Basic certificate, or an Advanced certificate in controlled airspace or near bystanders. See drone licence training.
Research institution buying before fiscal year-end? See institutional purchasing and drones for research teams. Don't want to fly it yourself? We fly mapping jobs after a job assessment.
Common questions
Mapping crop vigour and stress with bands the eye can't see, such as red edge and near infrared, to find problem areas, compare fields over time and build variable-rate prescription maps.
NDVI uses red and near infrared and is best early in the season. NDRE uses red edge and near infrared and keeps working in dense mid-season canopies, where NDVI saturates.
No. It shows where the crop differs. You still need to check those spots on the ground and sample soil or tissue before deciding what to do.
Near solar noon in steady light, with the same settings each time, so flights on different days can be compared. Avoid patchy cloud if you can.
Yes. Tools such as DJI Terra build prescription files that an Agras controller can load, once an agronomist approves the rates. Check the format and run a test first.
The DJI Mavic 3 Multispectral suits most farms, agronomists and research plots: four 5 MP bands plus a 20 MP RGB camera, a sunlight sensor and RTK in a drone under 1 kg.
Yes. A drone over 250 g must be registered and flown with a Transport Canada pilot certificate: Basic or Advanced, depending on where you fly. See drone licence training.
More Applications
Fertilizer drones: spreading granular fertilizer by drone
A fertilizer drone spreads granular fertilizer on wet, soft or irregular fields and patches a ground spreader can't reach. At 100 kg/ha one T50 load covers about 0.5 ha (1.2 acres), so it is a precision tool, not a replacement for bulk spreading.
Potato late blight: spraying fungicide by drone on wet rows
A spray drone can apply potato fungicide when rows are too wet for a sprayer, if the label allows aerial use at its aerial water volume. It fills gaps in a late blight program; it doesn't replace your sprayer or your province's spray-interval advice.
Orchard and vineyard spraying with drones
Spray drones can treat orchards, vineyards and berry blocks on slopes and wet rows an airblast sprayer can't reach, but they spray from above at a lower water volume, so canopy coverage differs. Check the label allows aerial use and test coverage first.
Want to see a drone do this job on your farm?
Tell us the crop, the job and your timing. Demonstrations use clean water and show the flight, refill and crew workflow.
Book a demo